
I’m fascinated by culture and I’ve been obsessed with contemporary art, design, and media for two decades. I began my career as an artist, took a detour into being an art critic for a few years, then became a professional electronic musician for the bulk of my creative life. After co-founding a start-up and then working as a UX designer for a decade, I am now solidly in the next phase of my career in information design and data visualization.

Monroe N. Work was an African American sociologist, scholar, and researcher who spent his life collecting information and helping others to understand it.

A look inside the 1945 math book by George Polya which established the field of Heuristics and created a template for how to solve any problem. I consider this from a dataviz perspective and compare to design thinking.
A new generation of text-to-image generative models are rapidly changing what is possible in generative design.
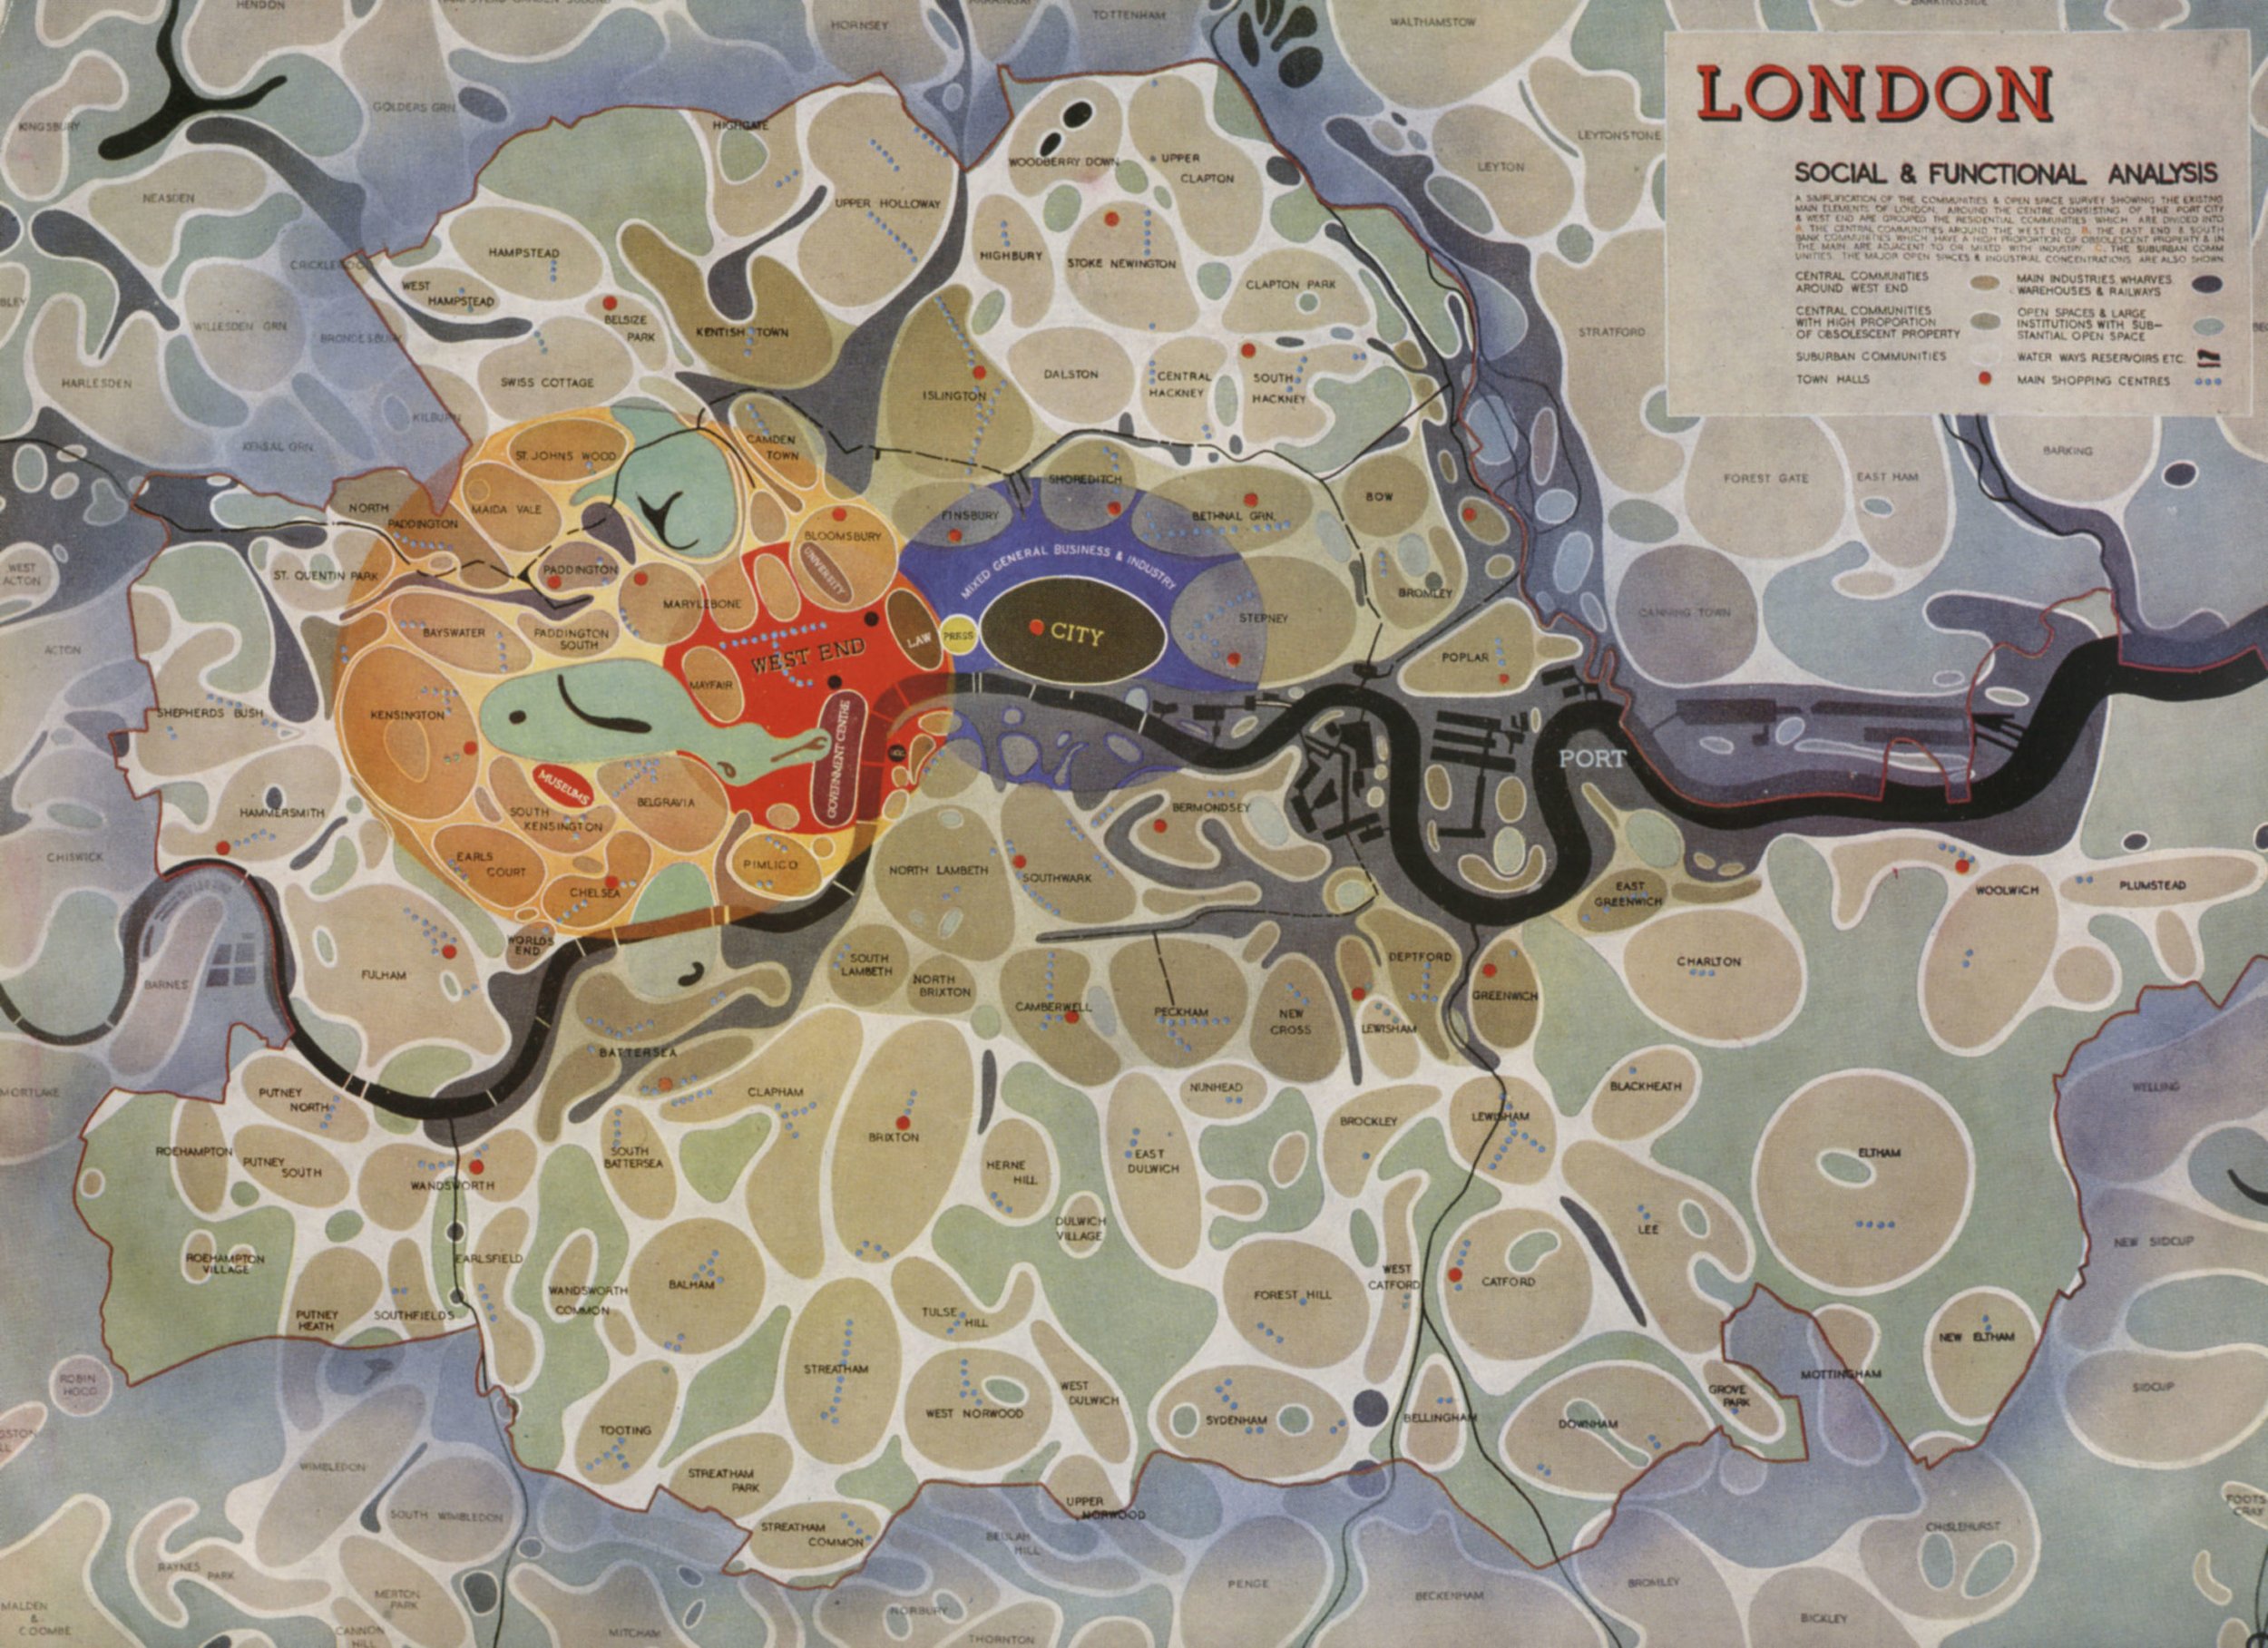
One of my favorite works of data visualization is a map from “The Greater London Plan” in 1944 by Patrick Abercrombie and J.H. Forshaw. It was a plan for recreating London after the bombing blitz of WWII, but it was also an attempt to reenvision the footprint of the city after unplanned 19th-century industrial development.

We are all conglomerations of our influences, remembrances, and fascinations but few artists have assembled them on as vast a scale as Julie Mehretu.
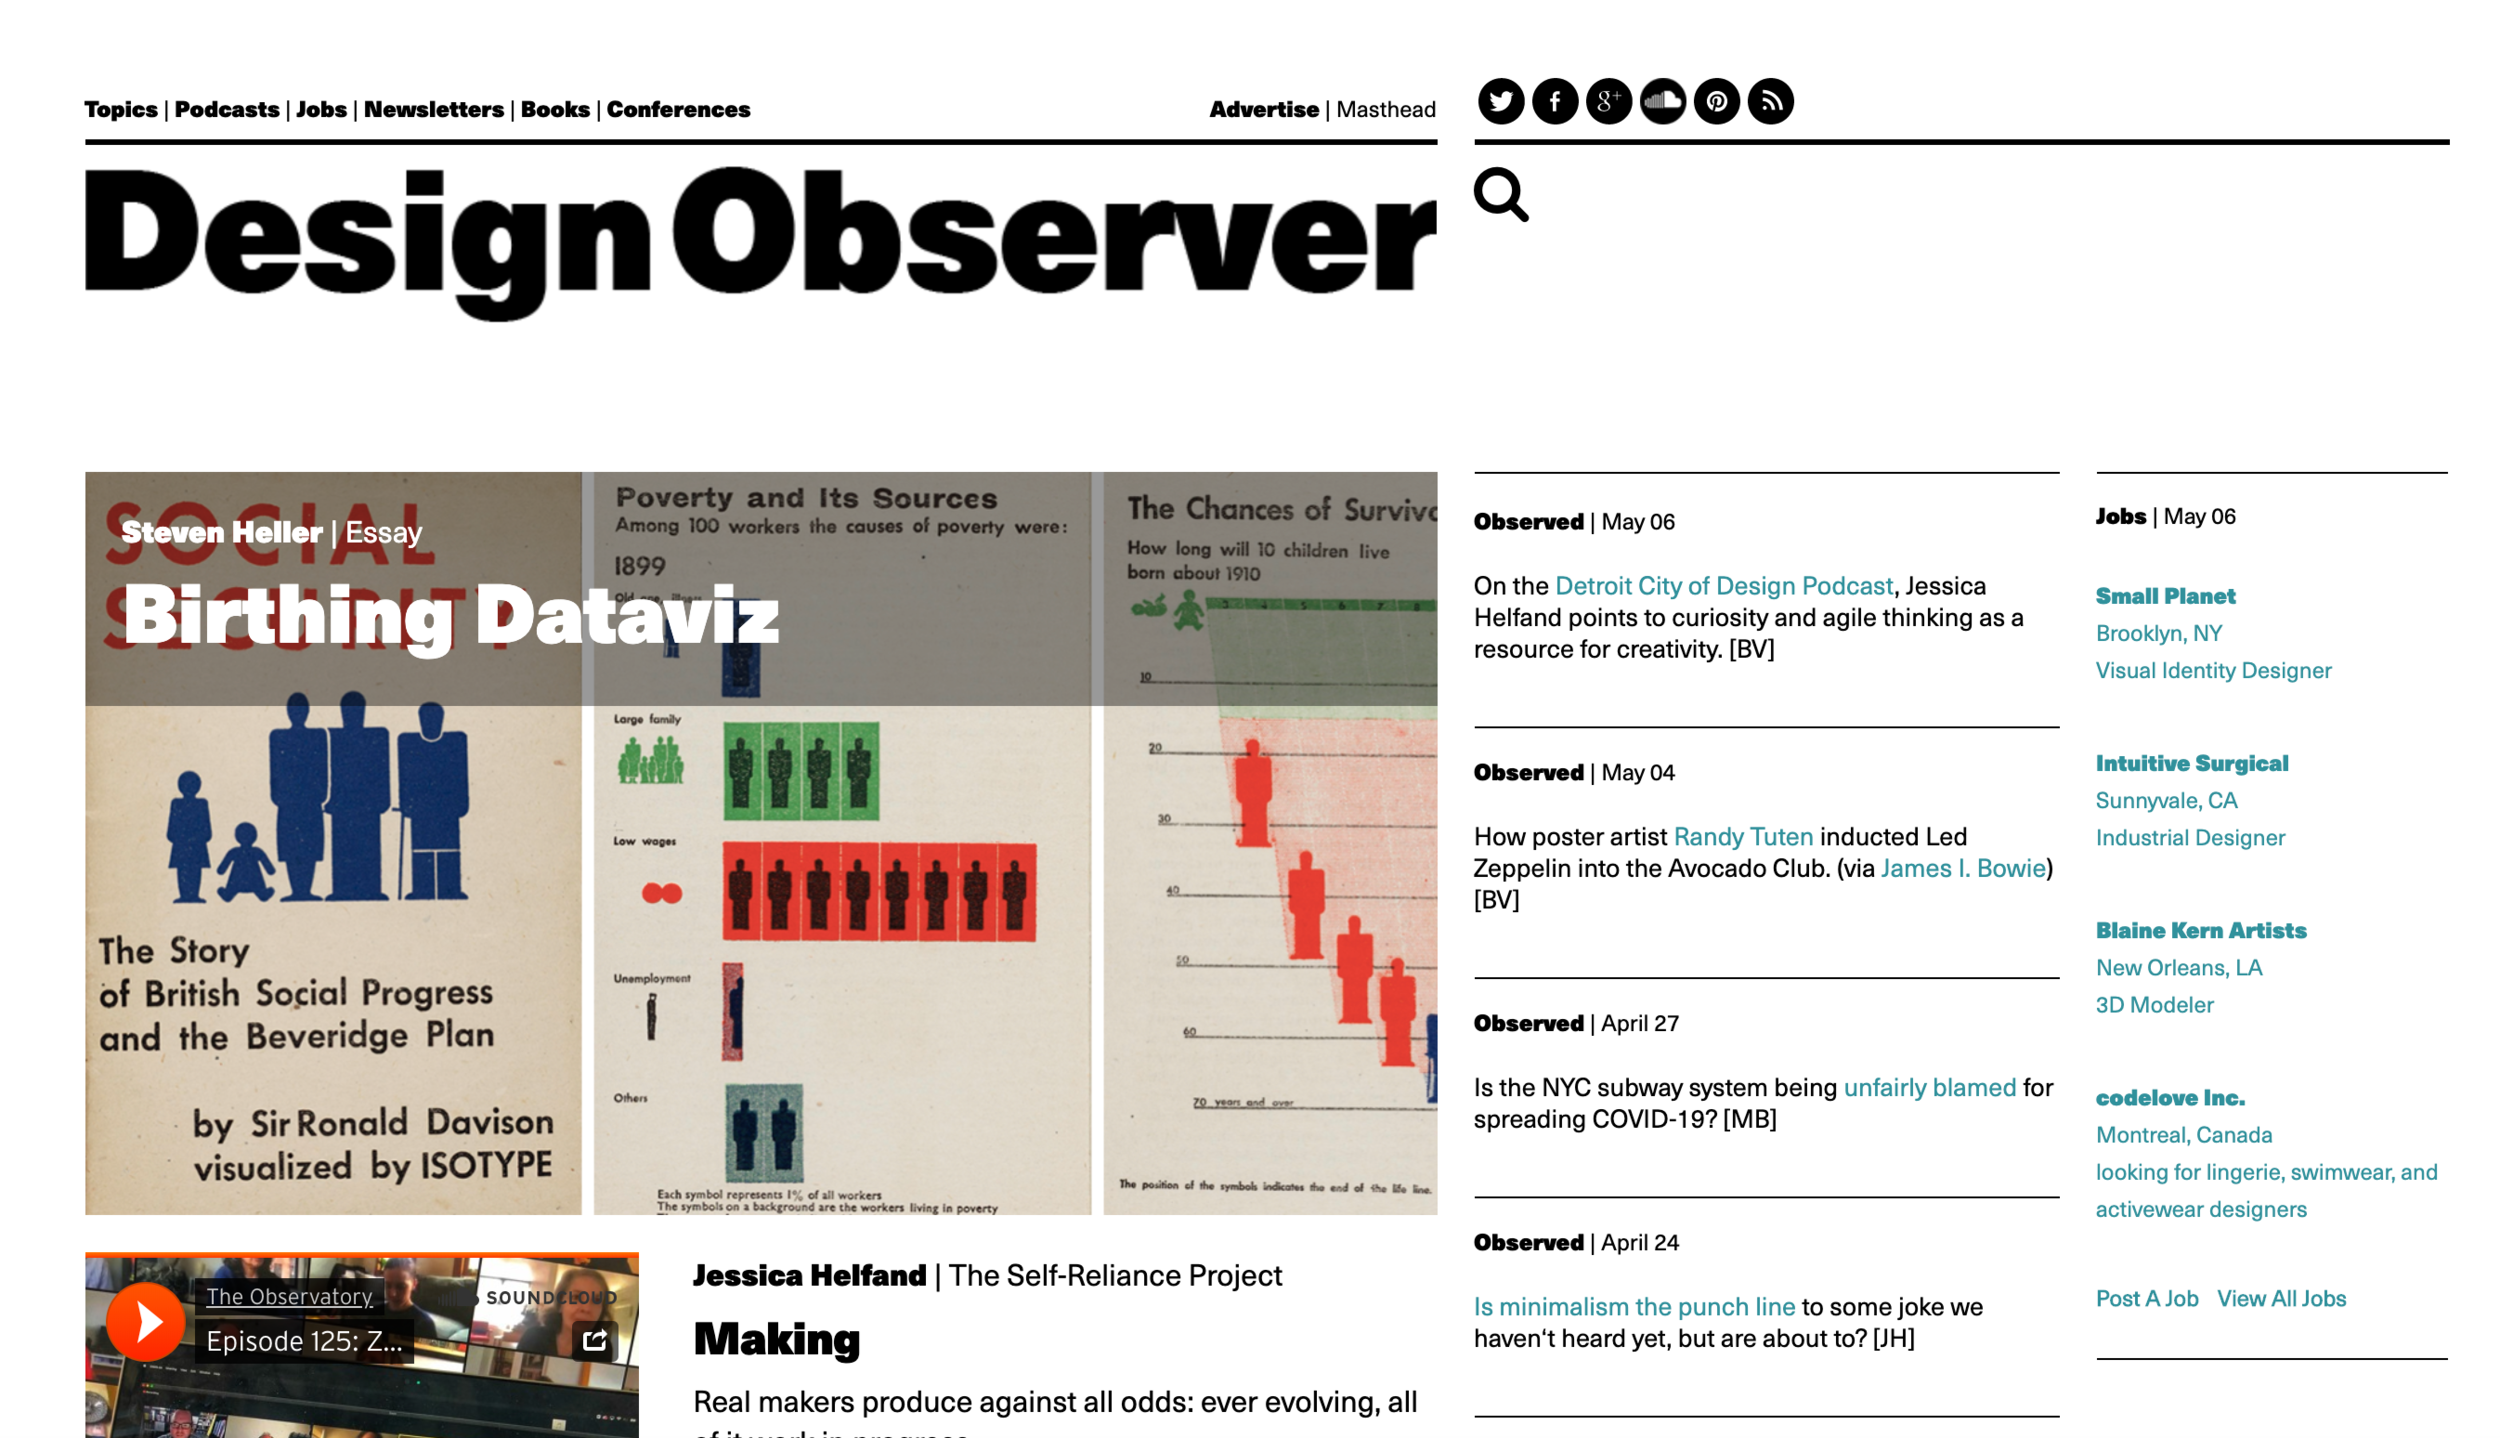
I’m delighted to have my ongoing Isotype research and pending first book covered by the great Steven Heller! Go check it out!

Recognizing the co-creator of the Isotype as a data visualization pioneer

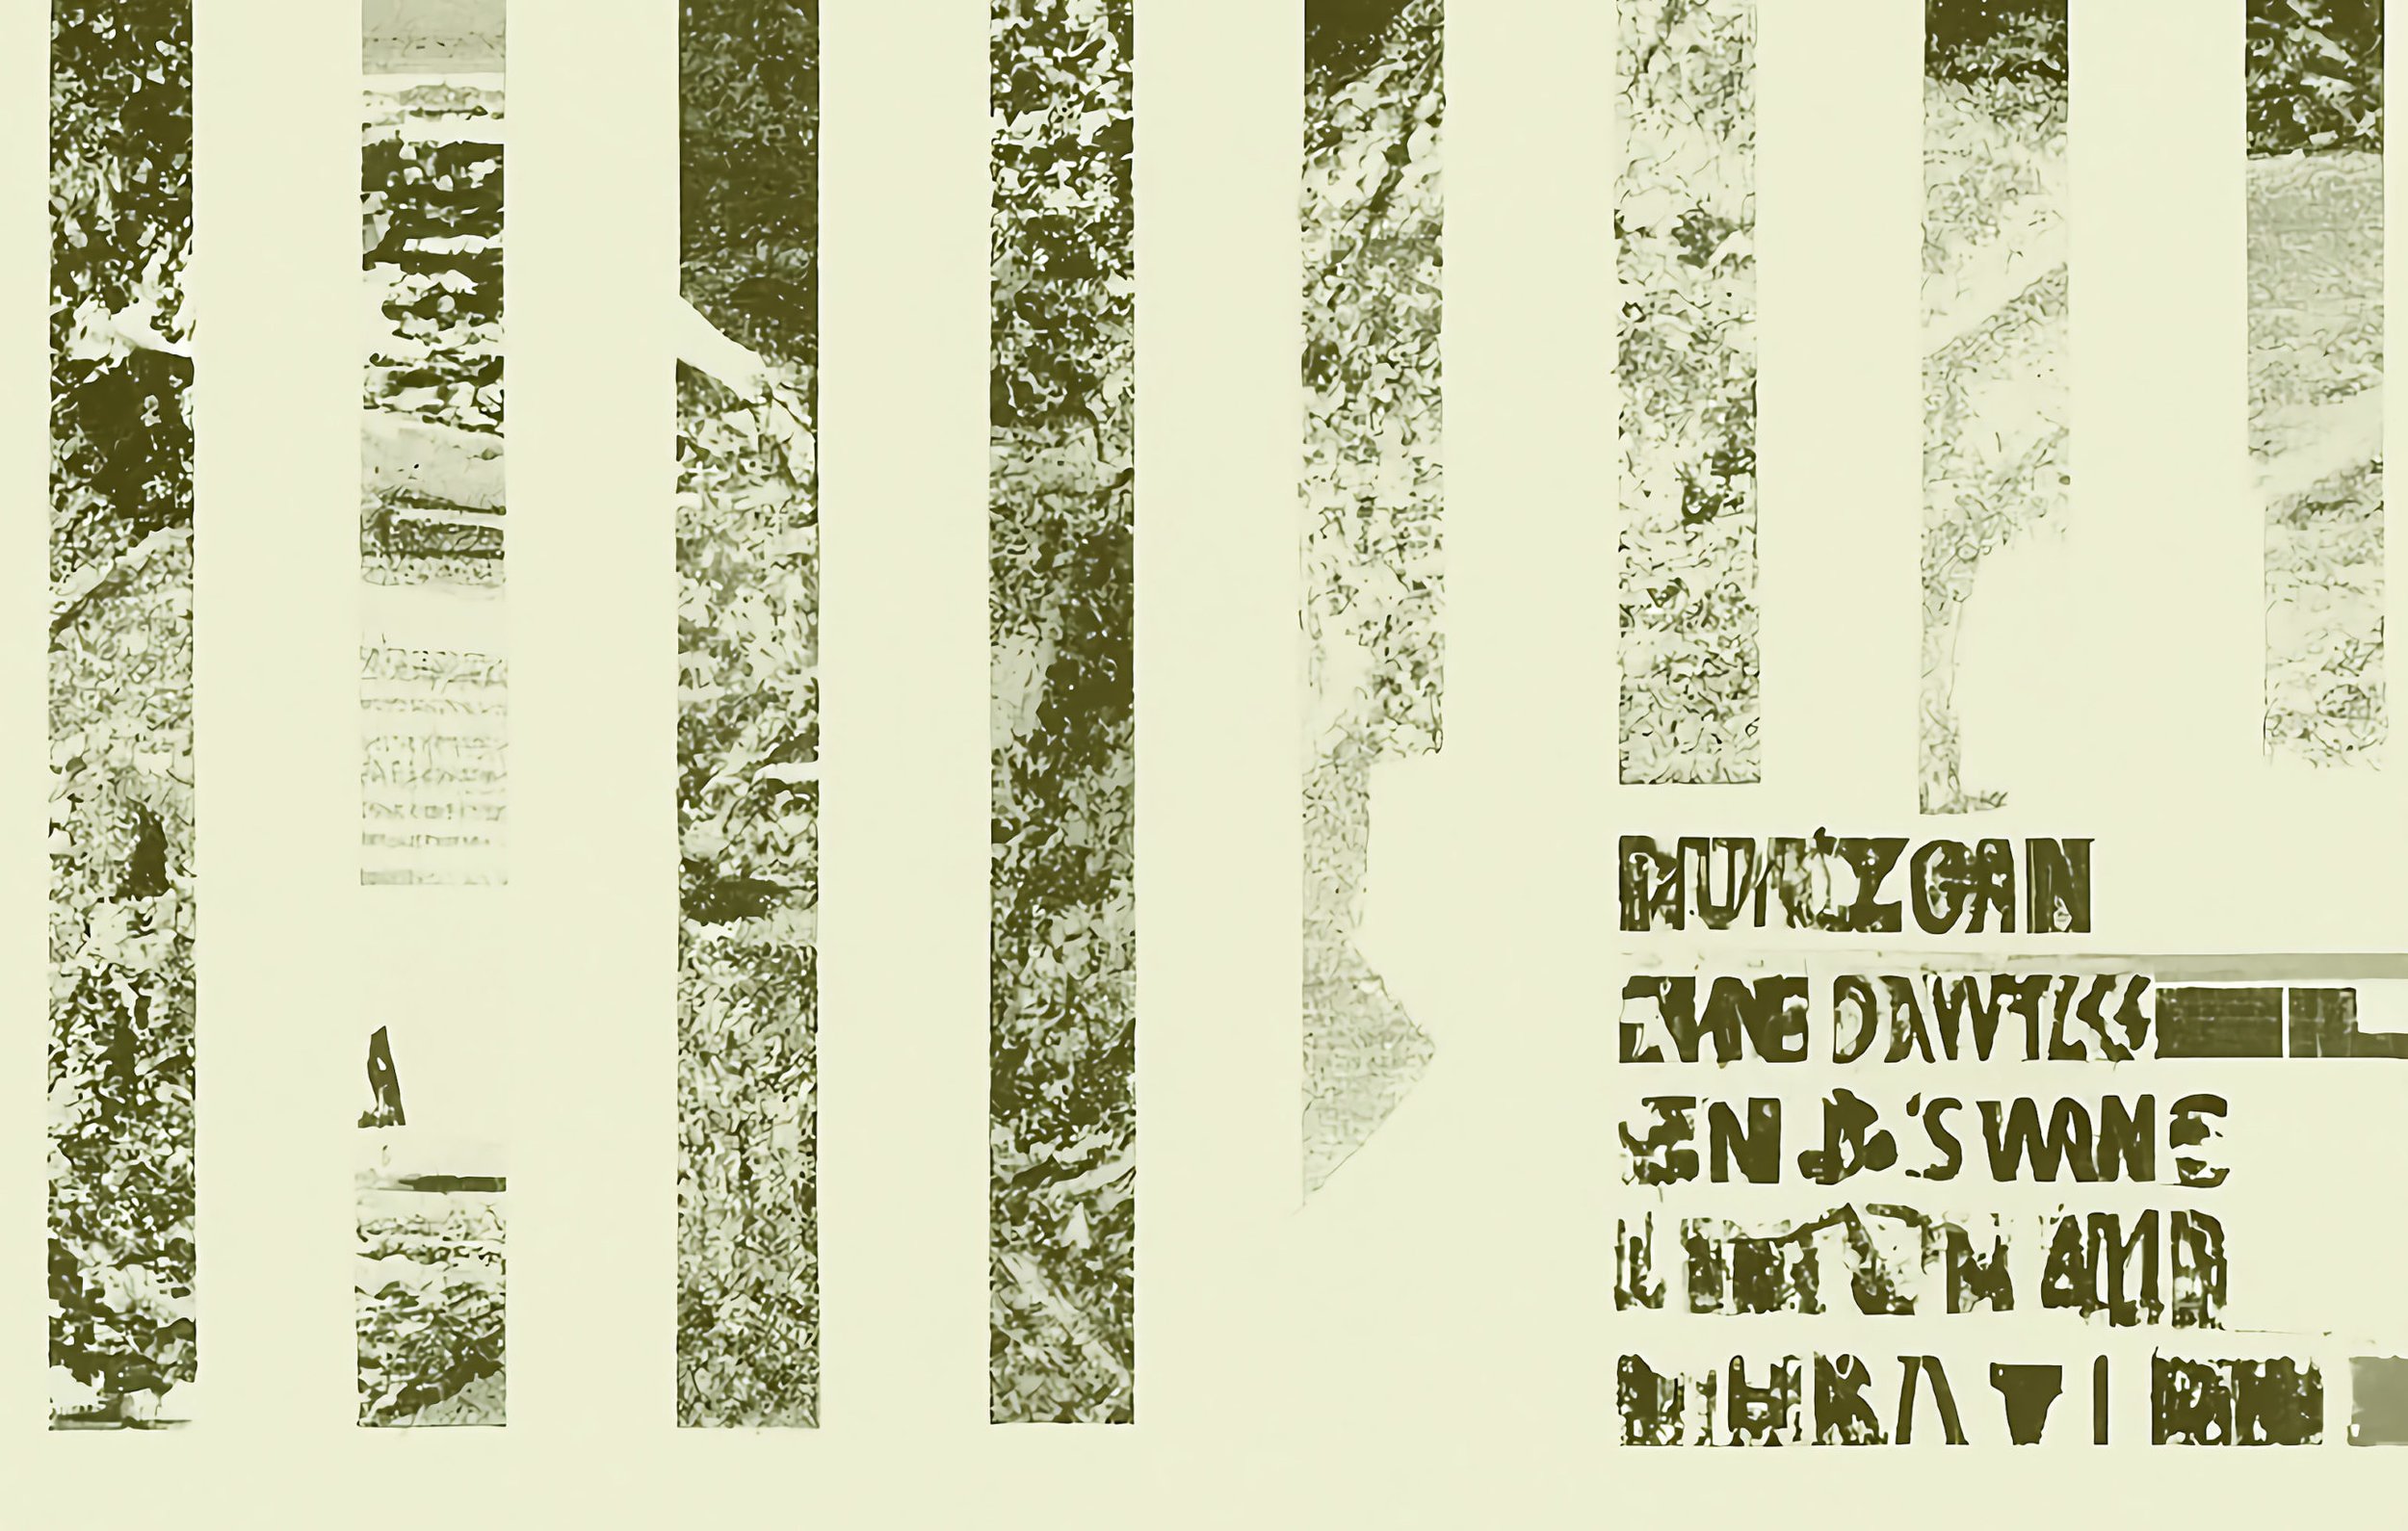
Why Cornelius Cardew’s legendary 193-page graphic score might not actually be about music

How the Soviet Union used data to inspire, terrify, and persuade the proletariat

Dr. Chris Mullen’s drive to collect and share information has created a fascinating archive with a focus on Fortunes Magazine and the history of visual communication
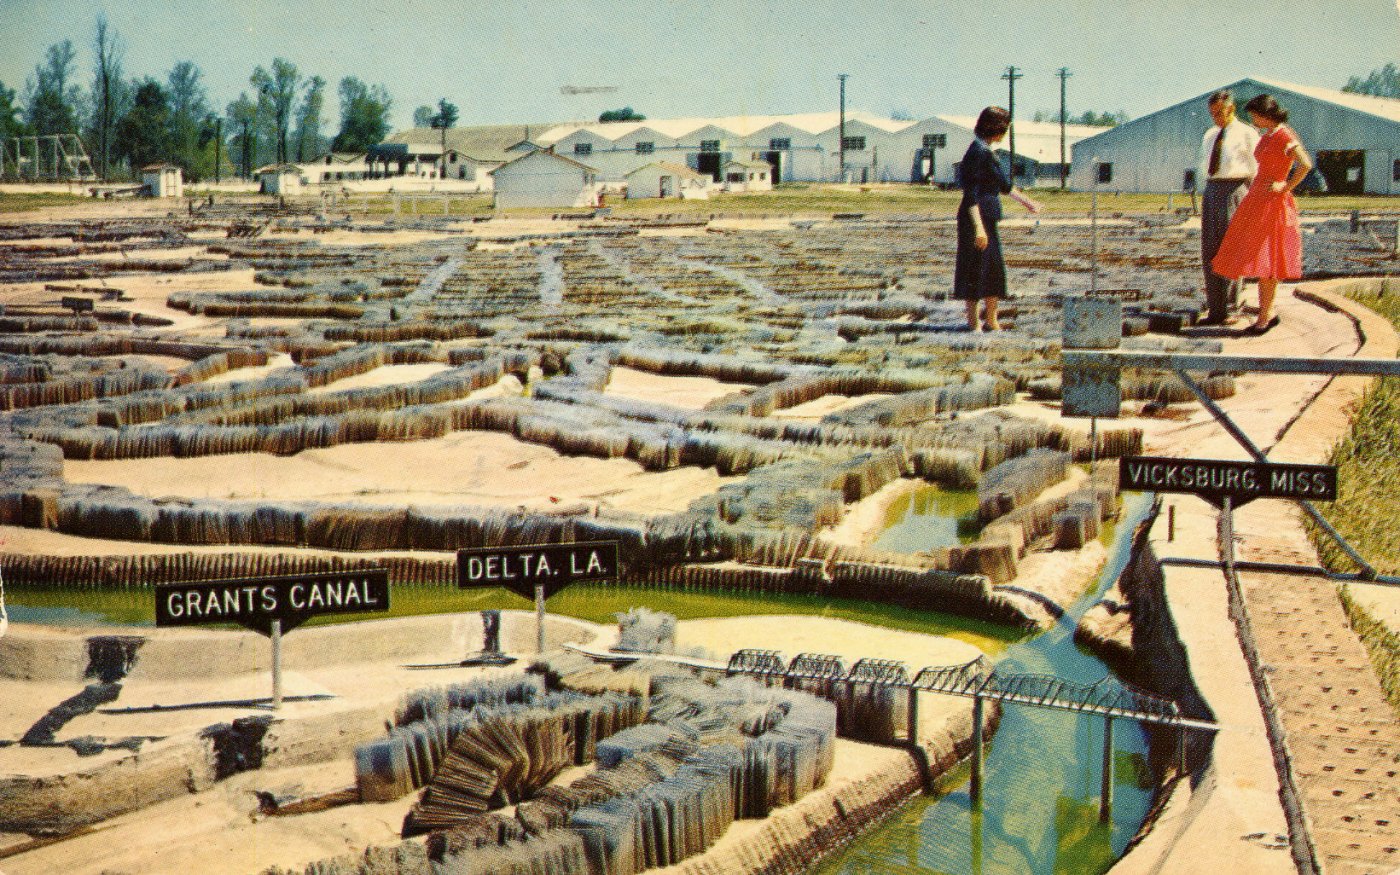
Modeling Reality: Physical Data Visualizations
Highlighting various three-dimensional representations of data as surfaced by the Data Visualization Society #Historic-Viz channel.

John Chappelsmith, “Map of the Track of the Tornado of April 30th, 1852”
Chappelsmith sought to prove the physics behind the meteorological phenomenon.

There’s really nothing as visually satisfying as a pictorial map. Each densely packed, illustrated map is a visual feast for the eyes…

How a lost Swedish artist is challenging historical concepts of abstraction and spiritualism 69 years after her death.

An interview from 1972 highlights the difficulty in explaining creative flow.
Oh, I also contributed to this BBC video about the history of Dataviz: